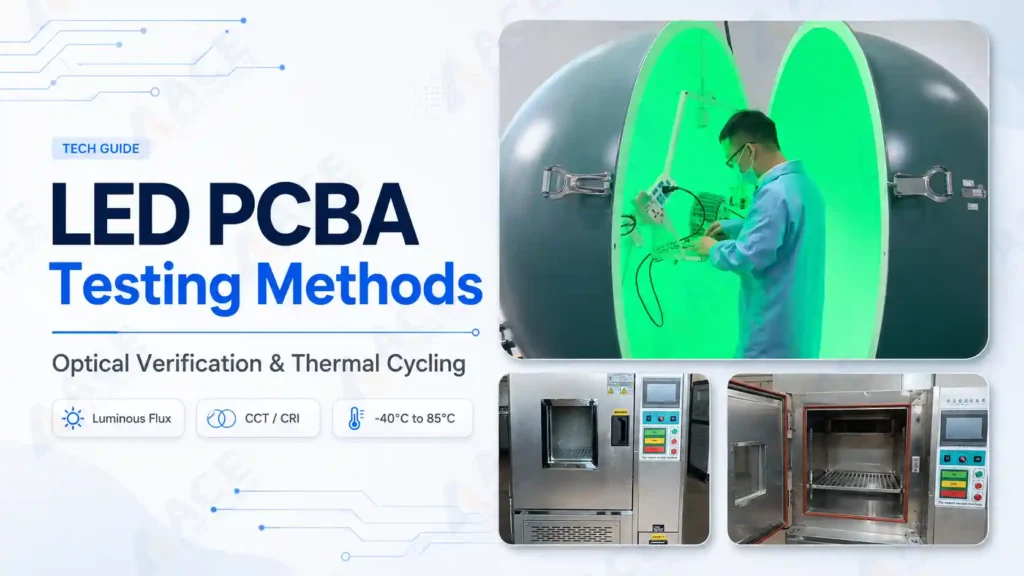
An assembled LED board can look right, power on, and still miss its required light output or color range. The problem isn't always visible: electrical input, operating mode, stabilization time, mounting, and board temperature all shift the measured result.
For lighting boards, the real question isn't "Do the LEDs turn on?" It's "Does this assembly meet the approved optical requirement under a recorded condition — and does it still hold after the specified environmental test?"
First, confirm the board is assembled correctly and basic function works. Then, if the project requires it, do two more checks: measure light output and color against the agreed limits, and run the board through the defined high/low-temperature cycling.
Both tests answer one buyer's question: will the boards you receive meet your spec, and will they keep working in the field?
| Optical measurement | Temperature cycling | |
|---|---|---|
| What it checks | Brightness, color, rendering, efficiency | Survival under hot-cold stress |
| What you get | Every batch verified against the agreed limits | Soldering or components issues caught before shipment |
Why Standard PCBA Inspection Is Not Enough for an LED Assembly
Solder-paste inspection (SPI) and automated optical inspection (AOI) machines catch misplaced parts, wrong polarity, and bad solder joints. X-ray inspection finds hidden joints you can't see. Electrical testing finds opens and shorts circuits. A customer-defined functional test then confirms the board powers up and responds as intended.
These checks answer one question: was the PCB assembly correctly? None of them measures light. A LED board can pass every check above and still put out too little brightness or the wrong color temperature — outside its required luminous-flux, CCT, CRI, chromaticity, or efficacy range.
Don't judge the light with your eyes either. Human vision adapts to brightness and surrounding color, so two LED PCB that look identical on a bench can measure far apart. The numbers have to come from a measuring instrument, not a person.
If you're hunting soldering or placement problems about PCB Assembly, see the guide to common SMT defects. For test fixtures, programming, and interfaces, see functional and PCBA testing.
This article covers what comes after LED assembly: optical measurement and temperature cycling.
Which Optical Results Matter After LED PCB Assembly?
For an LED light board or module, the results that matter are usually five: how bright it is (luminous flux), how warm or cool the light looks (CCT), how faithfully it shows colors (CRI), where its color sits on the chart (chromaticity coordinates), and how efficiently it turns power into light (luminous efficacy).
| Optical quantity | What it describes | Watch out |
|---|---|---|
| Luminous flux | How much visible light the board puts out | Compare only under the same input and setup |
| Correlated color temperature (CCT) | Whether the light looks warm or cool | Judge against the approved range, not "warm white" |
| Color rendering index (CRI) | How faithfully colors appear under the light | Confirm the metric and method your spec requires |
| Chromaticity coordinates | Where the measured color sits on the color chart | State the coordinate system and allowed region |
| Luminous efficacy | Light output divided by the power it draws | Use light and power readings from the same operating state |
The Device Under Test Defines the Scope of the Result
The same LEDs measure differently at different stages. Example: a light board may measure 1000 lm on the integrating sphere, but once the driver, lens, and housing are added, the finished luminaire may measure only 850 lm. The lens absorbs some light, the driver burns some power, and the enclosed board runs hotter — and heat lowers LED efficiency.
So the report must state exactly what was measured. "Light board: 1000 lm" and "finished luminaire: 850 lm" are different claims, and one must never be presented as the other.
Test 1: What an Integrating-Sphere Measurement Adds
An on/off check only tells you the board lights up. An integrating sphere tells you how much — it collects light from all directions and turns it into one repeatable reading. That number is what you compare against the approved limits.
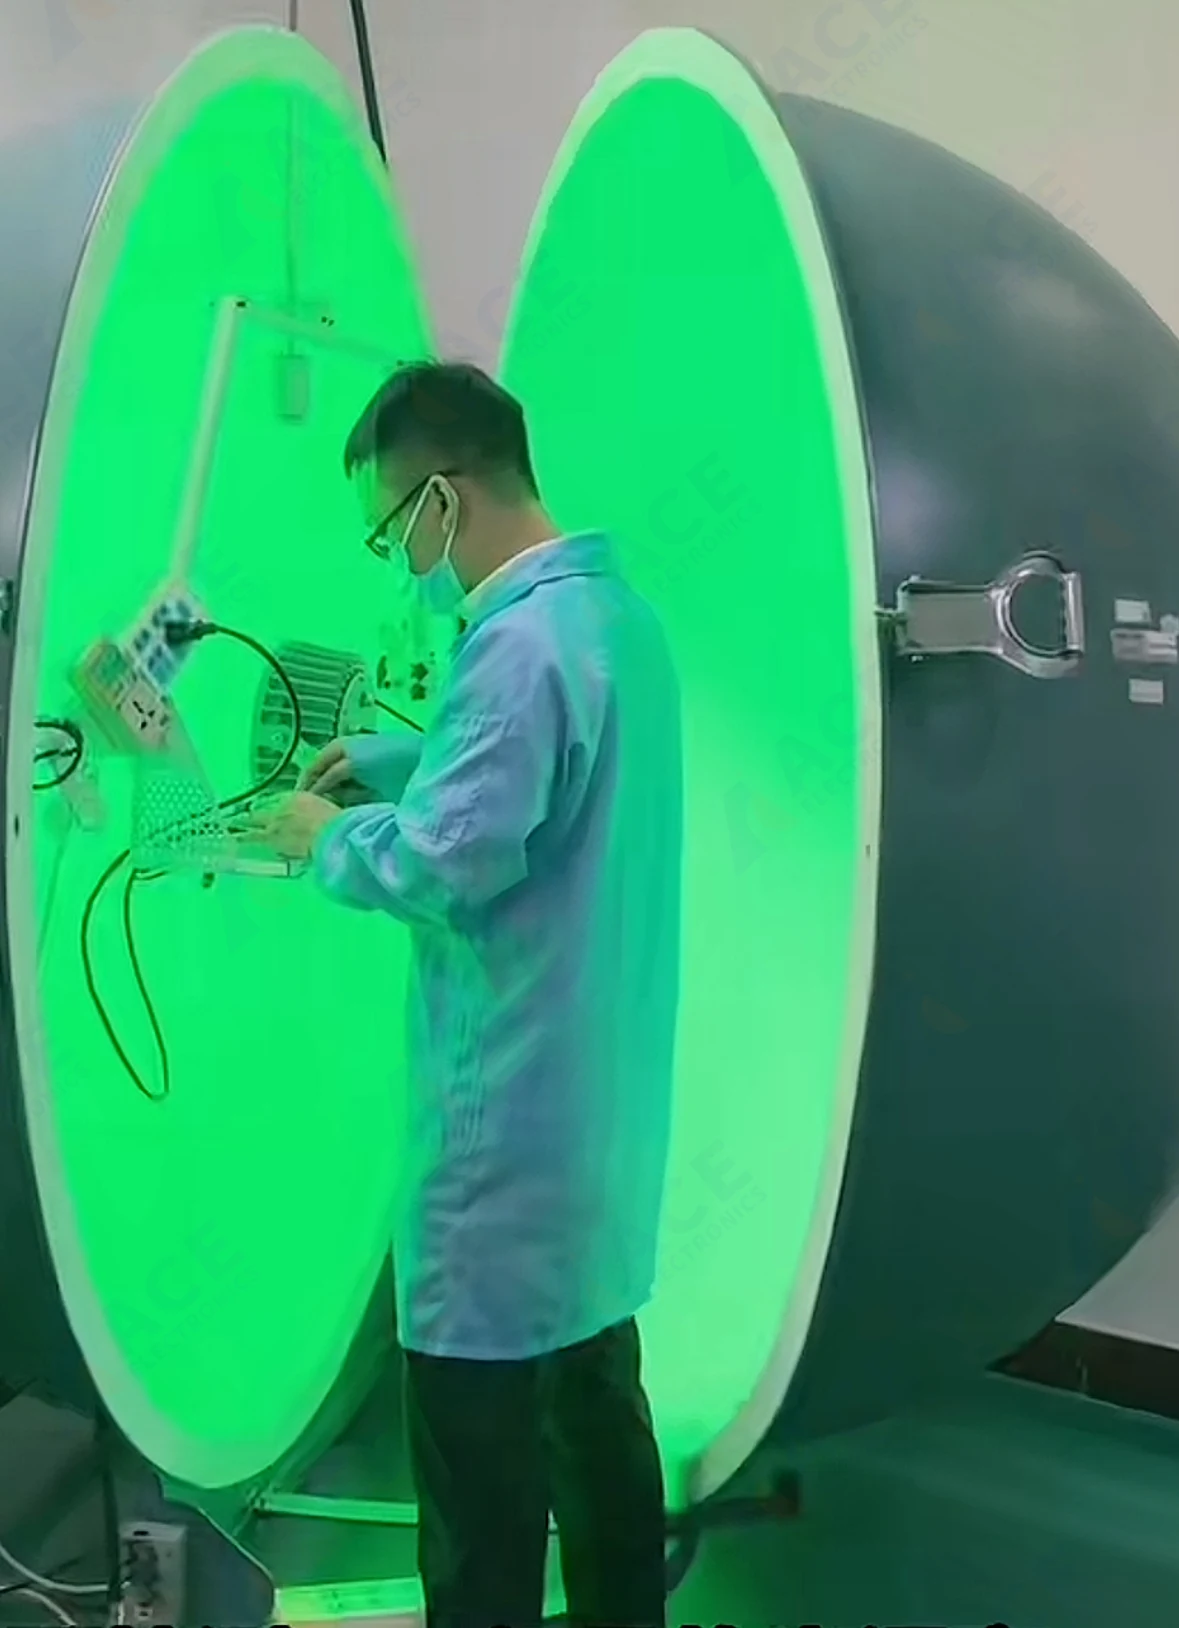
An LED lighting assembly is prepared for integrating-sphere measurement of luminous flux, CCT, CRI, chromaticity and luminous efficacy.
At ACE Electronics, the sphere setup measures luminous flux, color temperature, CRI, chromaticity coordinates, and luminous efficacy for light boards or lighting modules. Which quantities are included depends on the project and the agreed method — the report states it.
The sphere is the right tool for LED boards and LED modules, but not for complete luminaires. A large fixture — a street light, for example — doesn't suit the sphere's geometry: the housing absorbs and shadows light, and even the auxiliary-lamp correction method can't bring the sphere reading in line with a goniophotometer. That's why finished luminaires belong in a dark room on a goniophotometer, which measures total flux and beam angle.
This also explains why the same lamp can be quoted with very different numbers by different suppliers: one factory tests the module in a 1.5 m sphere, another in a 3 m sphere, a third quotes the complete luminaire. The product is the same — the setups are not. Before comparing numbers, compare the reports behind them.
Measurement Conditions Determine Whether Results Are Comparable
Measurement details aren't paperwork — they control what the reported number means. One example: set the board to 30% dimming and the flux drops; measure 10 seconds after power-on or after 30 minutes of warm-up, and the numbers differ too. Both readings are "correct" — they're just taken under different conditions. That's why every condition has to be on the record:
- Electrical input: What voltage and current, which driver, and whether the supply is stable.
- Operating mode: Dimming level, selected channel, or control mode must match the approved condition.
- Stabilization: A fixed rule for when the reading is taken after power is applied.
- Thermal configuration: Mounting, heat sink, interface material, and airflow change the operating temperature.
- DUT position and configuration: The board's orientation and assembly stage must stay the same between measurements.
- Measurement setup: Instrument configuration, calibration status, sphere size, and sample placement must suit the board being tested.
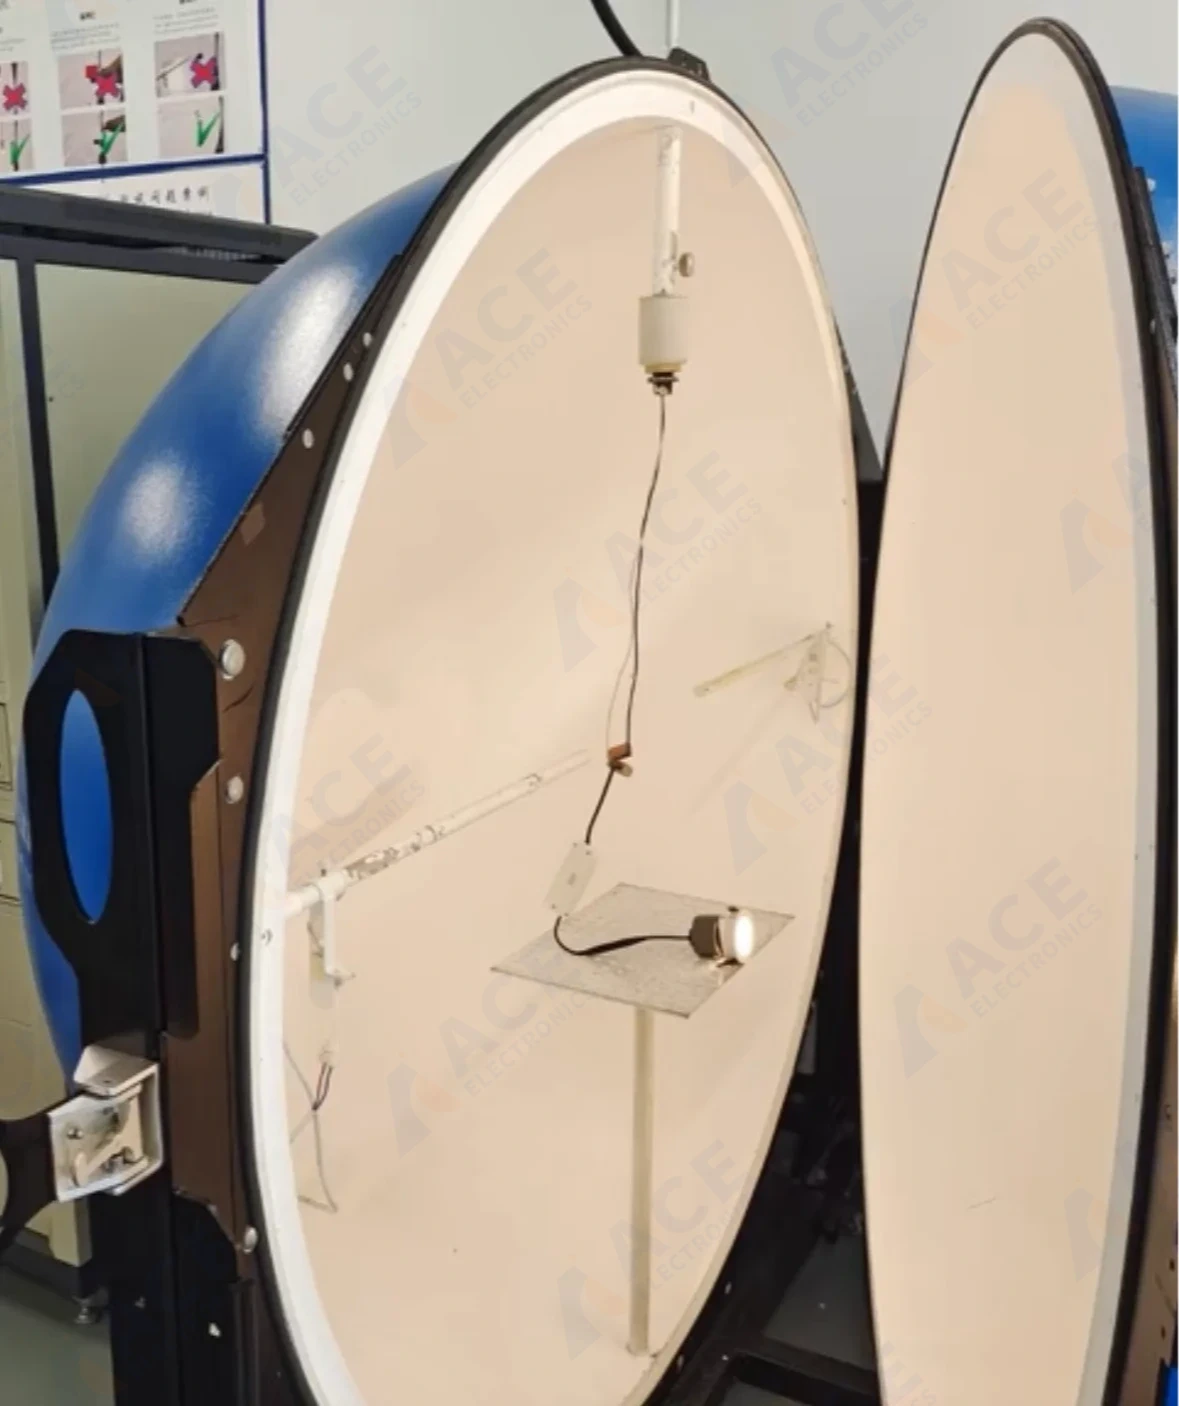
The sample position, mounting fixture, wiring and detector configuration must remain controlled so optical results can be compared under the same test conditions.
Reading the Report Against an Approved Limit
Check each result against the project requirement under the same recorded condition. Example: the spec requires 5500 K ± 300 K; the report shows 5600 K after 30 minutes of stabilization at 350 mA — a pass, with the conditions recorded so the measurement can be repeated.
Judge a CCT value by the approved range, not an informal label like "warm white." Use light and power readings from the same operating state for efficacy, and if the project allows a change between two measurements, keep the input, stabilization rule, and optical setup identical.
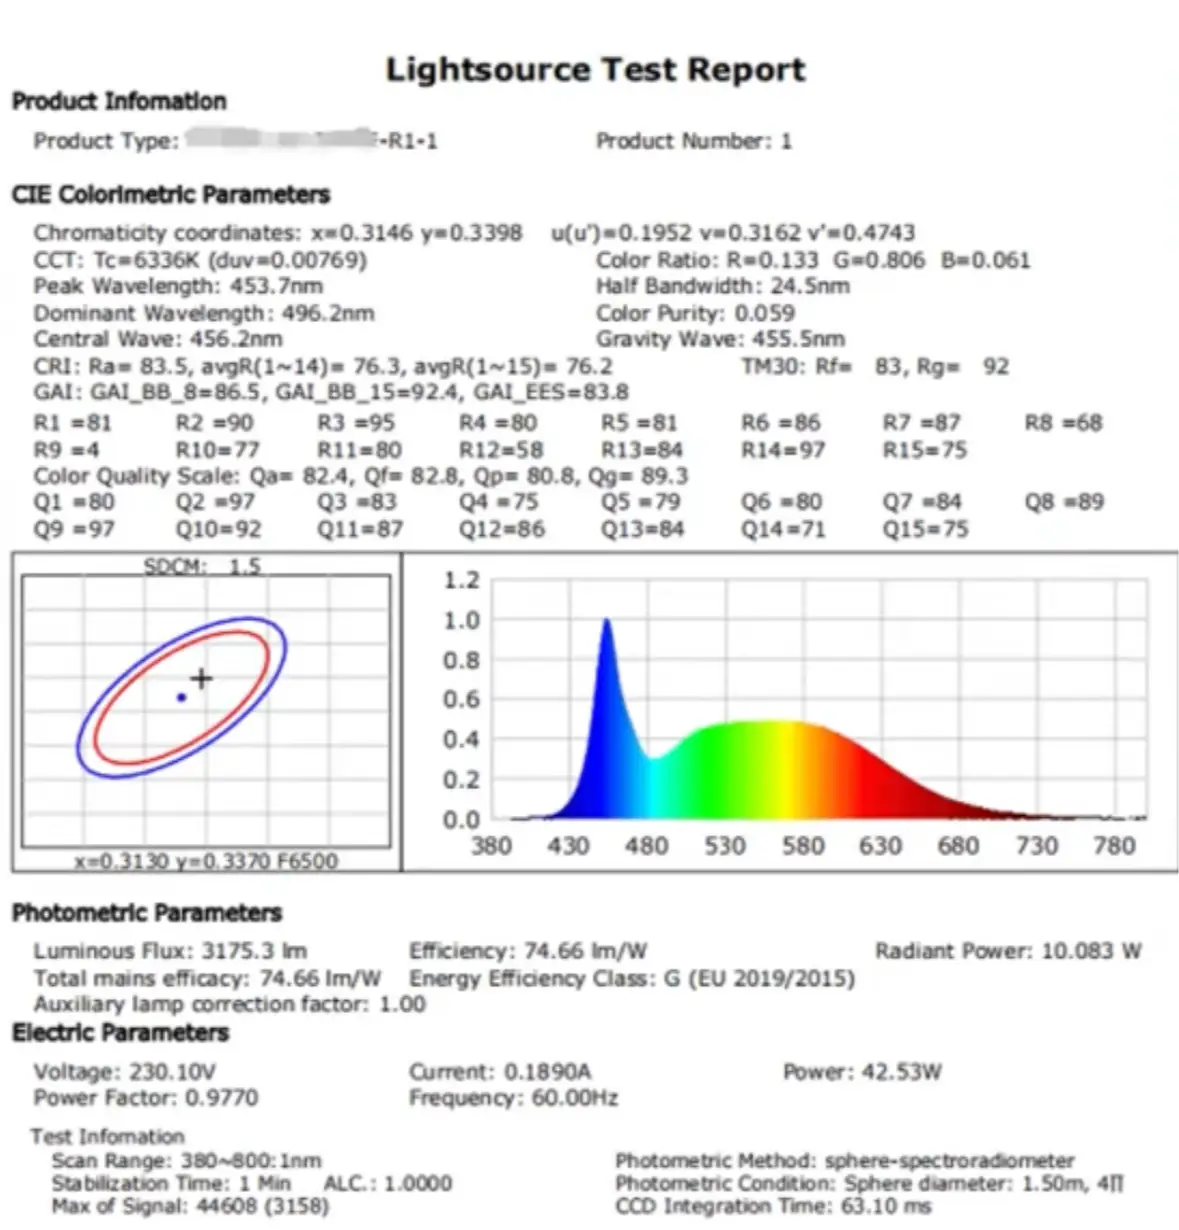
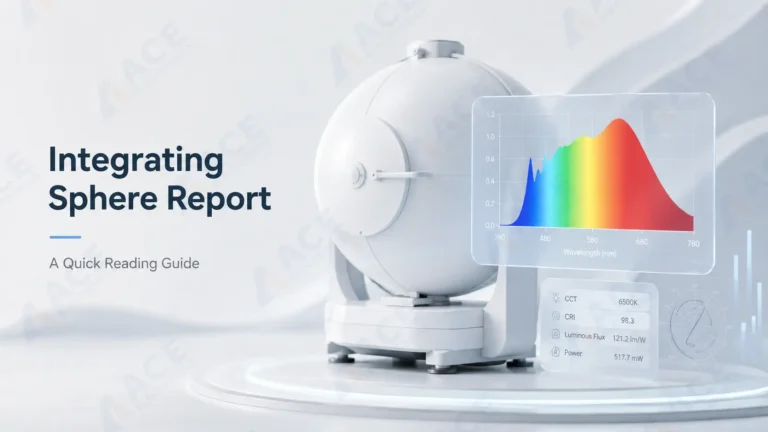
Example integrating-sphere report for an LED luminaire. Before comparing results, confirm the device under test, electrical input, stabilization time, measurement method and recorded optical parameters.
For a parameter-by-parameter explanation of luminous flux, efficacy, CCT, chromaticity, Duv, SDCM, CRI, R9 and TM-30, read our guide on how to read an LED integrating sphere test report.
A useful report lists four things:
- the device under test;
- the operating and measurement condition;
- the measured quantity; and
- the approved acceptance limit.
What the Measurement Does Not Prove
A sphere reading is a snapshot: this board, under this condition, at this moment. It doesn't prove LED lifetime, electrical safety, EMC, or any certification — those need separate tests, often on different samples and in different labs.
And a passing optical reading doesn't mean the finished product is done. Once the lens, housing, thermal structure, and power system are added, the product needs its own verification.
What Test 1 gives you: every batch ships with brightness and color measured against your spec — no guesswork, no surprises when the goods arrive.
Test 2: How High/Low-Temperature Cycling Should Be Defined
Why run it at all? A board that works fine at room temperature can fail under the seasons — an outdoor street light bakes in summer heat and freezes through winter nights, year after year. High/low-temperature cycling simulates that stress: it moves the specimen repeatedly between cold and hot, exposing weak solder joints, cracked connections, and parts that expand at different rates — problems that only show up when a board is heated and cooled again and again.
At this level — the assembled board — the usual requirement is simple: look the board over and power it on, both before and after the cycling.
The Recipe Controls the Result
Every temperature-cycling test needs its numbers: how hot, how cold, how long, how many times, and powered or not. Change any of them and you have a different test — 50 cycles from -40°C to 85°C is not the same evidence as 5 cycles from 0°C to 60°C.
A complete recipe looks like this: hold the board at -40°C for 30 minutes, warm it to 85°C over 30 minutes, hold for 30 minutes, then repeat 50 times. Every project defines its own numbers:
- lower and upper temperatures;
- heating and cooling, or ramp, rate;
- dwell time at the required conditions;
- number of cycles;
- powered or unpowered specimen state;
- load and operating mode when powered;
- recovery or conditioning before inspection; and
- the checks and pass/fail limits applied at each required stage.
Who defines the numbers? The customer's project requirement — or a named standard such as IEC 60068-2-14:2023, quoted with its exact edition, method, severity, and reporting requirements.
One more thing: a powered cycle is harsher than an unpowered one. With current flowing, solder joints face thermal and electrical stress at the same time, so more defects surface.
Comparing Light Output Before and After the Cycling Test
The simplest way to know whether cycling test hurt the board: measure its light before, run the cycle test, then measure again under the exact same setup. If the two readings differ within the allowed change, the board passes.
- Measure the light output before the test. Record brightness and color under the agreed power and setup — this is the "before" number.
- Run the high/low-temperature cycling test. The board goes through the defined temperatures, times, and cycle count.
- Let the board return to room temperature. Let it settle before the next reading — a hot board measures differently.
- Measure the light output again. Same power, same setup, same waiting time as step 1 — this is the "after" number.
- Compare the two readings. The allowed difference is set by the project; the report shows both numbers against that limit.
What Test 2 gives you: boards that survive the agreed cycles ship with known margins — cracked joints and weak solder show up in our lab, not in your customer's hands.
Summary
Test 1 checks the light: does the board meet the brightness and color spec? Test 2 checks the survival: does the board come through the hot-cold cycling intact? Both answers hold only within the recorded conditions and the approved limits.
You provide the BOM, Gerber files, assembly drawings, LED specifications, and acceptance requirements — we build and test to those documents. Certification decisions for the complete product stay with you.
If your project involves LED light boards, modules, or drivers with project-defined optical or environmental verification, ACE Electronics can assemble and test them — see our LED PCB assembly and lighting PCBA manufacturing capabilities.
Frequently Asked Questions
What can an integrating sphere measure for an LED assembly?
What can an integrating sphere measure for an LED assembly?
Depending on equipment configuration and method, it can measure luminous flux, CCT, CRI, chromaticity coordinates, and luminous efficacy. The report must identify the DUT and test condition so results are interpreted at the correct assembly level.
Why must an LED assembly stabilize before optical measurement?
Why must an LED assembly stabilize before optical measurement?
The LED junction, board, and thermal path change temperature after power is applied. A defined stabilization rule reduces variation from measuring at different points in that warm-up period and makes repeated results more comparable.
Is a light-board measurement the same as a finished-luminaire measurement?
Is a light-board measurement the same as a finished-luminaire measurement?
No. Drivers, heat sinks, lenses, reflectors, diffusers, enclosures, and final operating modes can change the result. The report should state whether it applies to a populated board, module, subassembly, or finished luminaire. And the test method should match the object: an integrating sphere for boards and modules, a dark-room goniophotometer for complete luminaires.
Why do different suppliers quote different luminous flux for the same light?
Why do different suppliers quote different luminous flux for the same light?
Because the test setups differ. Sphere size (1.5 m vs 3 m), sample position, operating condition, and whether the number covers a board, a module, or the complete luminaire all change the result. Compare the reports, not just the numbers.
How should high/low-temperature cycling be specified for an LED PCBA?
How should high/low-temperature cycling be specified for an LED PCBA?
Define the temperature limits, ramp rate, dwell time, cycle count, powered or unpowered state, load and operating mode when powered, recovery condition, inspection points, and pass/fail criteria. Use the project requirement or the exact applicable standard — not an assumed universal profile.
Can optical performance be compared before and after temperature cycling?
Can optical performance be compared before and after temperature cycling?
Yes, if the approved procedure requires it and the measurement capability is confirmed. Both readings should use the same DUT configuration, input, operating mode, stabilization rule, mounting, and optical setup, followed by a defined acceptance comparison.
Do optical measurement and temperature cycling prove LED lifetime?
Do optical measurement and temperature cycling prove LED lifetime?
No. They give results for the recorded test condition and specified temperature profile. A lifetime conclusion requires a separate method, suitable data, and a valid reliability model for the relevant product and operating environment.