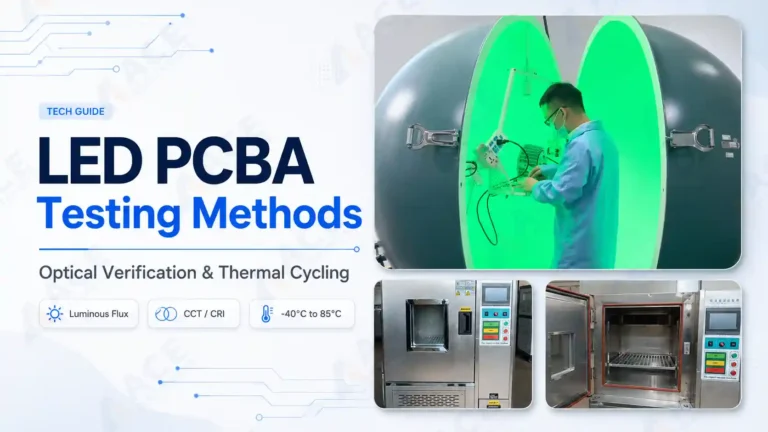
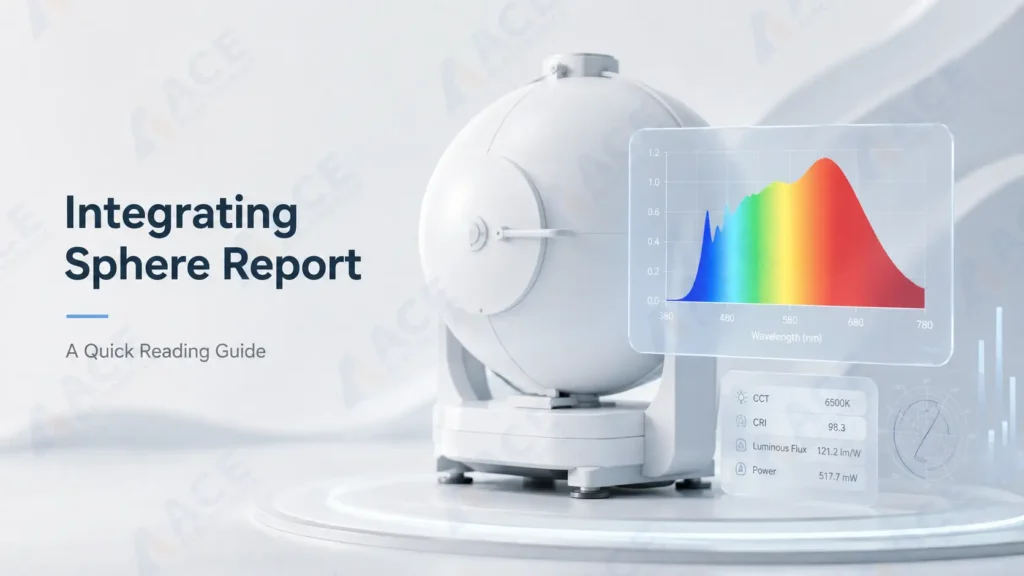
An integrating sphere test report shows the optical, color and electrical performance of an LED, LED module or complete luminaire.
The most important data normally includes:
- Luminous flux
- Luminous efficacy
- Color temperature
- Chromaticity coordinates
- CRI and individual R values
- Spectral distribution
- Voltage, current and power
- Power factor
- Test conditions
This guide explains how to read each value using two real test reports as examples.
For a broader explanation of how optical measurement fits into production inspection and environmental verification, see our guide to LED PCBA testing methods, including integrating-sphere measurement and high/low-temperature cycling.
1. First Confirm What Was Tested
Before comparing any data, identify the test object.
It may be:
- A single LED package
- An LED PCB or module
- A complete lamp
- A complete luminaire with driver and optical components
Example A: Complete LED Lighting Product
The first report shows:
- Input voltage: 230.10 V AC
- Input current: 0.1890 A
- Input power: 42.53 W
- Luminous flux: 3175.3 lm
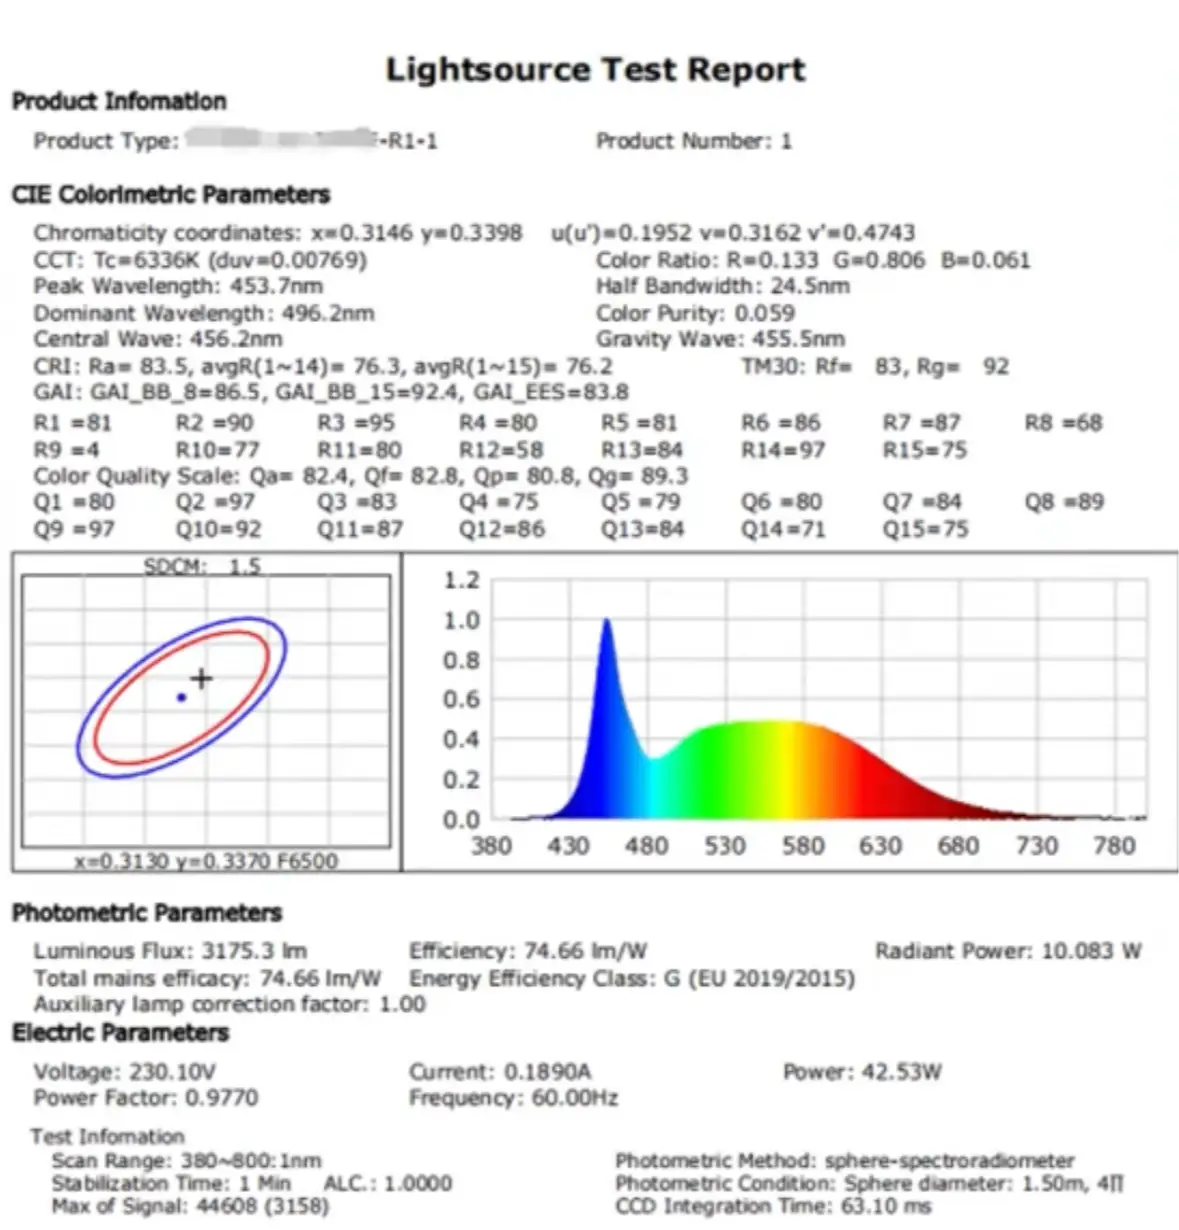
Figure 1. Integrating sphere test report for a complete LED luminaire, showing 6336 K CCT, 3175.3 lm luminous flux, 74.66 lm/W efficacy and 42.53 W input power.
Example B: Individual 2835 LED Package
The second report shows:
- Product model: 2835
- Forward voltage: 8.636 V
- Forward current: 59.94 mA
- Input power: 517.7 mW
- Luminous flux: 62.76 lm
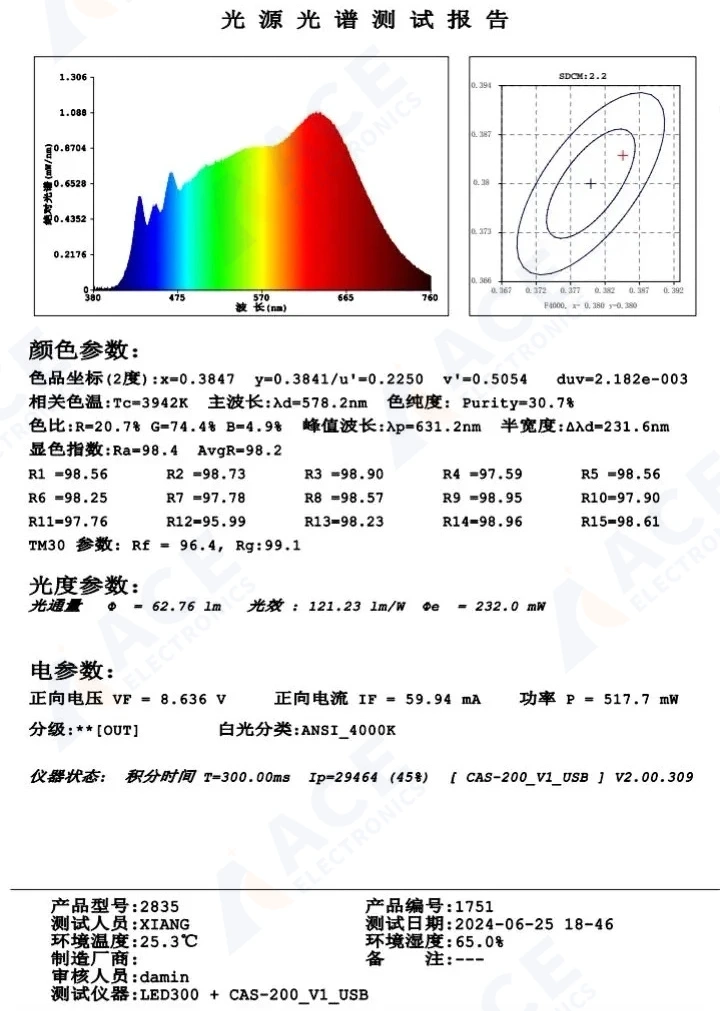
Figure 2. Integrating sphere test report for a 2835 LED package, showing 3942 K CCT, CRI Ra 98.4, R9 98.95, 62.76 lm luminous flux and 121.23 lm/W efficacy.
Do not directly compare a single LED package with a complete luminaire. A complete product includes driver, thermal and optical losses.
2. Spectral Power Distribution
The colored graph in the report is the spectral power distribution.
It shows how much light is emitted at different wavelengths.
- Horizontal axis: wavelength, normally from 380 to 780 nm
- Vertical axis: relative spectral intensity
Blue Peak
Most white LEDs use a blue LED chip combined with phosphor.
The narrow peak around 450–460 nm normally represents the blue LED chip.
In Example A, the peak wavelength is approximately:
- Peak wavelength: 453.7 nm
Phosphor Emission
The wider green, yellow, orange and red area is produced by the phosphor.
A stronger red spectral region normally supports:
- Lower color temperature
- Better red color rendering
- Higher R9 performance
Comparison of the Two Reports
Example A has:
- A stronger blue peak
- Less deep-red energy
- A cool-white appearance
Example B has:
- A broader phosphor-emission region extending into red wavelengths
- A reported spectral peak at 631.2 nm
- A neutral-white appearance
- Much stronger red color rendering
3. Correlated Color Temperature
Correlated Color Temperature, or CCT, describes whether the light appears warm or cool.
| CCT Range | Typical Appearance |
|---|---|
| 2700–3000 K | Warm white |
| 3500–4000 K | Neutral white |
| 5000–6500 K | Cool white or daylight white |
Example A
- CCT: 6336 K
This is cool white light.
It may be suitable for:
- Industrial lighting
- Office lighting
- Warehouses
- Outdoor lighting
Example B
- CCT: 3942 K
- White-light classification: ANSI 4000K
This is neutral white light.
It may be suitable for:
- Offices
- Retail lighting
- Commercial interiors
- Task lighting
CCT does not indicate brightness or color-rendering quality. It only describes the general color appearance of the light.
4. Chromaticity Coordinates
Chromaticity coordinates define the exact color point of the light source.
The most common values are CIE x and y coordinates.
Example A
- x = 0.3146
- y = 0.3398
Example B
- x = 0.3847
- y = 0.3841
- u′ = 0.2250
- v′ = 0.5054
These coordinates show the exact position of the light on the CIE chromaticity diagram.
They are more precise than CCT alone.
Two LEDs may both be rated at 4000 K but still appear different because one may look greener and the other more pink or magenta.
Chromaticity coordinates are useful for:
- LED bin selection
- Batch consistency control
- Color matching
- Incoming inspection
- Comparing production samples
5. Duv
Duv indicates how far the measured color point is from the black-body locus.
In simple terms:
- Positive Duv may appear greener
- Negative Duv may appear more pink or magenta
- A value closer to zero normally appears more neutral
Example A
- Duv: approximately +0.00769
This indicates a relatively clear positive deviation and may produce a slightly greenish appearance.
Example B
- Duv: +0.002182
This is a small positive deviation from the black-body locus. The light may have a slight green-side shift, but it is much closer to neutral than Example A.
CCT tells you whether the light is warm or cool. Duv helps identify green or magenta tint.
6. SDCM and Color Consistency
SDCM means Standard Deviation Color Matching.
It describes the difference between the measured color point and a target color point.
A lower SDCM normally means better color consistency.
| SDCM | General Interpretation |
|---|---|
| 1–2 | Very tight color consistency |
| 3 | High-quality commercial consistency |
| 4–5 | Some color difference may be visible |
| Above 5 | Color variation may be noticeable |
SDCM is important when many LEDs are installed together.
Poor color consistency may cause some LEDs to appear:
- More yellow
- More white
- More green
- More pink
SDCM is commonly checked during:
- LED incoming inspection
- Batch verification
- LED bin control
- Production quality control
Example B
- SDCM: 2.2
This indicates tight color consistency, close to a two-step MacAdam ellipse.
7. CRI Ra
CRI means Color Rendering Index.
Ra is the average value calculated from the first eight standard color samples, R1 to R8.
It indicates how naturally colors appear under the light source.
| CRI Ra | General Use |
|---|---|
| 70 | Basic industrial or outdoor lighting |
| 80 | General residential and commercial lighting |
| 90 | High-quality indoor and retail lighting |
| 95+ | Applications requiring high color accuracy |
Example A
- CRI Ra: 83.5
This is acceptable for general lighting.
Example B
- CRI Ra: 98.4
- Average R1–R15 value: 98.2
This indicates very high overall color-rendering performance.
Ra alone is not enough. Individual R values, especially R9, should also be checked.
8. Individual CRI Values
An integrating sphere report may show values from R1 to R15.
Each value represents the rendering of a different reference color.
R1 to R8
These values are used to calculate the general CRI Ra.
R9
R9 represents saturated red.
It is especially important for:
- Skin tones
- Food and meat displays
- Clothing
- Wood surfaces
- Artwork
- Medical observation
Example A
- R9: 4
Although the Ra value is above 80, red colors may appear weak, dull or inaccurate.
Example B
- R9: 98.95
This indicates excellent saturated-red reproduction.
This is one of the most important differences between the two reports.
Other Useful Values
- R12: saturated blue
- R13: skin-tone-related color
- R14: leaf green
- R15: additional skin-tone reference
Different applications may require attention to different R values.
9. TM-30 Data
Some reports also include TM-30 values.
Example A shows:
- Rf: 83
- Rg: 92
TM-30 Rf
Rf indicates overall color fidelity.
A higher value means colors are reproduced more accurately.
TM-30 Rg
Rg indicates average color saturation.
- Around 100: generally neutral saturation
- Below 100: average desaturation
- Above 100: average oversaturation
For Example A:
- Rf 83 indicates moderate color fidelity
- Rg 92 indicates that colors may appear slightly less saturated on average
Example B shows:
- Rf: 96.4
- Rg: 99.1
For Example B:
- Rf 96.4 indicates very high color fidelity
- Rg 99.1 indicates nearly neutral average color saturation
TM-30 normally provides more color information than CRI because it evaluates more color samples.
10. Luminous Flux
Luminous flux indicates the total amount of visible light emitted by the product.
The unit is lumen, written as lm.
Example A
- Luminous flux: 3175.3 lm
This is the total output of the complete lighting product.
Example B
- Luminous flux: 62.76 lm
This is the measured output of one 2835 LED package.
A higher lumen value means more total visible light, but it does not automatically mean:
- Better efficiency
- Better color quality
- Better color rendering
- Better product reliability
11. Luminous Efficacy
Luminous efficacy shows how efficiently electrical power is converted into visible light.
The unit is lm/W.
The calculation is:
Luminous efficacy = luminous flux ÷ input power
Example A
- Luminous flux: 3175.3 lm
- Input power: 42.53 W
- Luminous efficacy: 74.66 lm/W
Example B
- Luminous flux: 62.76 lm
- Input power: 0.5177 W
- Luminous efficacy: 121.23 lm/W
Example B has a higher measured efficacy, but this does not necessarily mean that the finished product will be more efficient.
Example A may include losses from:
- AC/DC driver
- LED PCB heating
- Diffuser
- Lens
- Reflector
- Housing
- Optical cover
- Internal temperature rise
Example B is probably measured directly at the LED package level.
Always compare efficacy data from products tested at the same level and under similar conditions.
12. Radiant Power
Radiant power measures the total optical energy emitted by the light source.
It is different from luminous flux.
Example A
- Radiant power: 10.083 W
Example B
- Radiant power: 232.0 mW
Lumens are weighted according to human-eye sensitivity.
Radiant power measures optical energy without applying the same visual weighting.
Radiant power is especially useful for:
- UV lighting
- Infrared lighting
- Plant lighting
- Optical sensors
- Scientific light sources
13. Peak Wavelength
Peak wavelength is the wavelength where the spectral intensity reaches its maximum.
In Example A:
- Peak wavelength: approximately 453.7 nm
In Example B:
- Peak wavelength: 631.2 nm
Example A is dominated by its blue-chip peak. In Example B, the broad phosphor-emission region reaches the highest measured intensity near the red region. This does not mean Example B is a red LED; its complete spectrum still produces neutral-white light.
Peak wavelength is more useful when evaluating:
- Blue LEDs
- Red LEDs
- Green LEDs
- UV LEDs
- Other narrow-band light sources
For white LEDs, the complete spectral shape is normally more important than the peak wavelength alone.
14. Dominant Wavelength
Dominant wavelength describes the perceived hue of the light source relative to a reference white point.
This value is more useful for colored LEDs than for white LEDs.
Example B reports:
- Dominant wavelength: 578.2 nm
For white lighting products, the following values are normally more useful:
- CCT
- Chromaticity coordinates
- Duv
- CRI
- Spectral distribution
15. Color Purity
Color purity describes how saturated a color is.
A high value indicates a more saturated or pure color.
A low value is normal for white light because white light contains a mixture of many wavelengths.
Example B reports:
- Color purity: 30.7%
Color purity is mainly useful for:
- Red LEDs
- Green LEDs
- Blue LEDs
- Indicator LEDs
- Decorative lighting
16. Voltage
Voltage shows the electrical condition used during testing.
Example A
- Voltage: 230.10 V AC
This indicates an AC-powered lighting product.
Example B
- Forward voltage: 8.636 V DC
This is higher than the forward voltage of a typical single-junction 3 V white LED. It suggests a multi-junction or high-voltage package, although the report does not show the internal LED configuration.
Check whether the measured voltage matches:
- Product specification
- LED datasheet
- Driver design
- Target market requirements
17. Current
Current strongly affects LED output, efficacy and temperature.
Example A
- Current: 0.1890 A
This is the AC input current of the complete lighting product.
Example B
- Forward current: 59.94 mA
This is the operating current of the LED package.
When comparing two LED reports, confirm that they were tested at the same current.
A higher test current may increase total light output but may also:
- Reduce efficacy
- Increase temperature
- Change chromaticity
- Accelerate aging
18. Input Power
Input power is the actual electrical power consumed during the test.
Example A
- Input power: 42.53 W
Example B
- Input power: 517.7 mW
Input power is used to calculate luminous efficacy.
Always use measured input power rather than nominal product power when evaluating a test report.
19. Power Factor
Power factor is mainly relevant to AC-powered lamps and luminaires.
Example A shows:
- Power factor: 0.977
A value close to 1 generally indicates good power-factor performance.
However, power factor does not indicate flicker performance.
A product can have a high power factor and still have visible or measurable flicker.
Flicker requires separate parameters, such as:
- Percent flicker
- Flicker index
- Pst LM
- SVM
20. Test Frequency
Example A shows:
- Frequency: 60 Hz
The test frequency should match the intended market and product specification.
For example:
- North America commonly uses 60 Hz
- Many other regions commonly use 50 Hz
Frequency alone does not show whether the light has low flicker.
21. Test Method and Conditions
The report may also show:
- Spectroradiometer type
- Integrating sphere size
- Scan range
- Stabilization time
- CCD integration time
- 2π or 4π measurement method
Scan Range
Example A shows:
- Scan range: 380–800 nm
This covers the main visible-light range.
Stabilization Time
LED output changes as the product heats up.
A product measured immediately after power-on may show:
- Higher initial lumens
- Different color temperature
- Different forward voltage
For accurate comparison, the LED or luminaire should reach a stable operating temperature before measurement.
Example B Test Conditions
The second report also shows:
- Integration time: 300.00 ms
- Ambient temperature: 25.3°C
- Ambient humidity: 65.0%
- Test instrument: LED300 + CAS-200_V1_USB
- Test date: 2024-06-25
The report does not clearly state the stabilization time or whether the measurement used a 2π or 4π configuration.
2π and 4π Measurement
A 4π test measures light emitted in all directions.
A 2π test is often used for directional products that emit mainly into one hemisphere.
The correct method depends on the product structure.
22. Comparison of the Two Example Reports
| Parameter | Example A | Example B | Meaning |
|---|---|---|---|
| Test object | Complete lighting product | Individual 2835 LED package | Different test levels |
| Input voltage | 230.10 V AC | 8.636 V DC | AC luminaire vs DC LED |
| Input power | 42.53 W | 0.5177 W | Very different product sizes |
| CCT | 6336 K | 3942 K | Cool white vs neutral white |
| CRI Ra | 83.5 | 98.4 | General vs very high color rendering |
| R9 | 4 | 98.95 | Weak vs excellent red rendering |
| Luminous flux | 3175.3 lm | 62.76 lm | Complete product vs one LED |
| Luminous efficacy | 74.66 lm/W | 121.23 lm/W | System-level vs package-level |
| Duv | +0.00769 | +0.002182 | Stronger vs smaller positive deviation |
| SDCM | Not shown | 2.2 | Tight color consistency in Example B |
| Power factor | 0.977 | Not applicable | Relevant to AC products |
| TM-30 | Rf 83, Rg 92 | Rf 96.4, Rg 99.1 | Moderate vs very high fidelity |
23. Recommended Reading Order
When reviewing an integrating sphere report, check the data in this order.
Step 1: Confirm the Test Object
Determine whether the report is for:
- An LED package
- An LED module
- An LED PCB assembly
- A complete lamp
- A complete luminaire
Step 2: Check the Electrical Conditions
Review:
- Voltage
- Current
- Input power
- AC or DC input
- Test frequency
Step 3: Check the Light Output
Review:
- Luminous flux
- Luminous efficacy
- Radiant power
Step 4: Check the Light Color
Review:
- CCT
- Chromaticity coordinates
- Duv
- SDCM
Step 5: Check Color Rendering
Review:
- CRI Ra
- R9
- Other individual R values
- TM-30 Rf and Rg
Step 6: Check the Spectral Graph
Look for:
- Blue peak position
- Red spectral content
- Missing wavelength regions
- Differences between production batches
Step 7: Check the Test Conditions
Confirm:
- Stabilization time
- Ambient temperature
- Integrating sphere method
- Scan range
- Equipment calibration
- Test date
24. Common Mistakes
Avoid these common mistakes when reading an integrating sphere report:
- Comparing a single LED with a complete luminaire
- Looking only at CRI Ra
- Ignoring R9
- Treating CCT as brightness
- Treating lumens as light quality
- Comparing lm/W without checking the test object
- Ignoring Duv and visible color tint
- Confusing radiant power with electrical input power
- Assuming high power factor means low flicker
- Ignoring LED operating current
- Ignoring stabilization time and test temperature
- Comparing reports from different laboratories without checking test methods
25. Quick Review Checklist
Before accepting an LED integrating sphere report, confirm:
- Product model and sample number
- Test object
- Input voltage
- Input current
- Actual input power
- Luminous flux
- Luminous efficacy
- CCT
- Chromaticity coordinates
- Duv
- SDCM
- CRI Ra
- R9
- Other required R values
- TM-30 data, if required
- Spectral distribution
- Power factor for AC products
- Test temperature
- Stabilization time
- Integrating sphere method
- Calibration and test date
Conclusion
An integrating sphere report should be read as a complete set of data.
No single value can fully define LED quality.
- Lumens show total visible light output
- lm/W shows energy efficiency
- CCT shows whether the light is warm or cool
- Duv shows green or magenta deviation
- SDCM shows color consistency
- CRI and R9 show color-rendering performance
- TM-30 provides more detailed color evaluation
- Voltage, current and power define the electrical test condition
- The spectral graph shows how the light energy is distributed
Most importantly, only compare products tested at the same level and under similar conditions.
A single LED, an LED module and a complete luminaire may show very different results even when they use the same LED technology.